Zimbabwe Population Pyramid (2026)
By Marko Visic · Updated
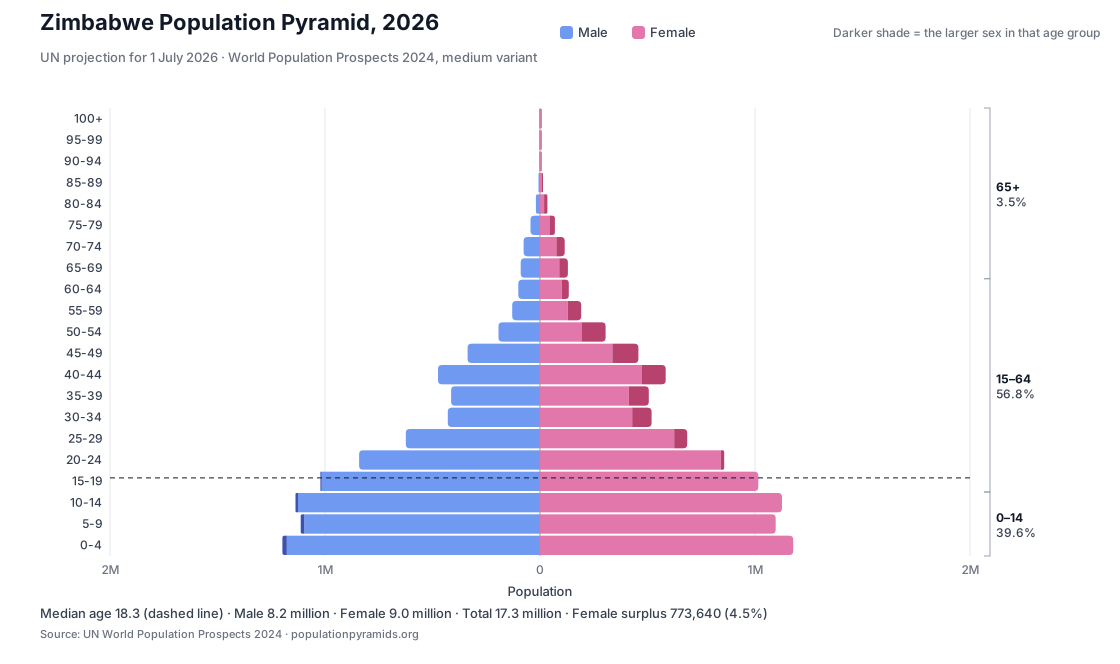
Zimbabwe has a population of 17,273,580 in 2026, according to the UN World Population Prospects 2024 (projection for 1 July). That is the 73rd-largest population in the world and 0.21% of the global total of 8.30 billion. Children under 15 make up 39.6% of the population and people aged 65 and over 3.5%, with 91.4 males for every 100 females.

Show the numbers
| Age group | Male | Female | Total | Share |
|---|---|---|---|---|
| 100+ | 27 | 124 | 151 | 0.00% |
| 95-99 | 360 | 1,164 | 1,524 | 0.01% |
| 90-94 | 1,854 | 4,542 | 6,396 | 0.04% |
| 85-89 | 6,838 | 13,984 | 20,822 | 0.12% |
| 80-84 | 19,202 | 34,309 | 53,511 | 0.31% |
| 75-79 | 44,186 | 69,282 | 113,468 | 0.66% |
| 70-74 | 76,331 | 114,710 | 191,041 | 1.11% |
| 65-69 | 89,640 | 129,703 | 219,343 | 1.27% |
| 60-64 | 101,052 | 134,073 | 235,125 | 1.36% |
| 55-59 | 129,074 | 191,795 | 320,869 | 1.86% |
| 50-54 | 193,032 | 305,251 | 498,283 | 2.88% |
| 45-49 | 336,569 | 457,526 | 794,095 | 4.60% |
| 40-44 | 474,385 | 584,882 | 1,059,267 | 6.13% |
| 35-39 | 413,352 | 506,252 | 919,604 | 5.32% |
| 30-34 | 428,915 | 519,108 | 948,023 | 5.49% |
| 25-29 | 624,393 | 684,726 | 1,309,119 | 7.58% |
| 20-24 | 841,175 | 856,954 | 1,698,129 | 9.83% |
| 15-19 | 1,021,500 | 1,015,499 | 2,036,999 | 11.79% |
| 10-14 | 1,137,110 | 1,125,608 | 2,262,718 | 13.10% |
| 5-9 | 1,112,990 | 1,096,430 | 2,209,420 | 12.79% |
| 0-4 | 1,197,984 | 1,177,687 | 2,375,671 | 13.75% |
| Total | 8,249,970 | 9,023,610 | 17,273,580 | 100.00% |
| Female surplus 773,640 (4.5% of the population). | ||||
Population pyramid, 1950 to 2026
Watch how Zimbabwe's population structure evolved from 1950 to 2026
Source: UN World Population Prospects 2024 (estimates to 2023, medium-variant projections from 2024).
Page Navigation
Zimbabwe sex ratio
Zimbabwe has 91.4 males per 100 females.
That is 773,640 more women than men (4.5% of the population). Men outnumber women up to 15–19; from 20–24 on, women outnumber men, and at 85 and over there are 2.2 women for every man.
Source: UN World Population Prospects 2024 (estimates to 2023, medium-variant projections from 2024).
Zimbabwe age structure
Zimbabwe has an expansive population pyramid. Its largest five-year band is 0–4, at 13.8% of the population.
Zimbabwe's under-15 share is the 23rd-highest of 194 countries.
The largest generation is Gen Z, at 32.6% (5,627,755). All generations in Zimbabwe
How the age structure shifted, 1950 to 2026
Source: UN World Population Prospects 2024 (estimates to 2023, medium-variant projections from 2024).
Key Demographics
| Total Population | 17,273,580 |
| Male Population | 8,249,970(47.8%) |
| Female Population | 9,023,610(52.2%) |
| Median Age | 18.3 years |
| Sex Ratio | 91.4 males per 100 females |
| Youth (0-14) | 6,847,809(39.6%) |
| Working Age (15-64) | 9,819,515(56.8%) |
| Elderly (65+) | 606,256(3.5%) |
| Total Dependency Ratio | 75.9 |
| Youth Dependency Ratio | 69.7 |
| Old Age Dependency Ratio | 6.2 |
| Pyramid Type | Expansive |
Dependency Ratios: Number of dependents per 100 working-age individuals.
Births and fertility rate
UN World Population Prospects 2024, 2026 (medium-variant projection).
How many births, and how often (2026)
In Zimbabwe there is about one birth every 62 seconds.
Birth-rate and fertility trend, 1950 to 2026
Crude birth rate · total fertility rate (dashed)Birth statistics, 2021 to 2026
| Year | Births | Birth rate (per 1,000) | TFR (children/woman) | Type |
|---|---|---|---|---|
| 2021 | 488,642 | 30.9 | 3.77 | estimate |
| 2022 | 496,240 | 30.9 | 3.77 | estimate |
| 2023 | 496,917 | 30.4 | 3.72 | estimate |
| 2024 | 497,215 | 29.9 | 3.67 | projection |
| 2025 | 500,731 | 29.5 | 3.62 | projection |
| 2026 | 505,305 | 29.3 | 3.57 | projection |
Since 1950
Global context (2026)
Source: UN World Population Prospects 2024. Births, birth rate and fertility for 2024 and later are medium-variant projections; 1950–2023 are estimates.
Fertility in context (2026)
That is above the replacement level of 2.1 children per woman, and ranks Zimbabwe 35 of 194 for fertility (1 = highest). The world average is 2.23, and the UN projects Zimbabwe's rate at 2.70 by 2050. Since 1950 the rate is down 49.3%, from 7.04 children per woman.
Zimbabwe median age
Zimbabwe's median age is 18.3 years
Half the population is younger than this and half is older, which makes Zimbabwe a very young society.
Worldwide, Zimbabwe's median age is the 18th-lowest of 194 countries.
Zimbabwe's median age changed by +1.5 years from 2016 to 2026, slower than the world average (+2.6 years).
It has risen from 17.4 years in 1950, and the UN projects 23.6 by 2050.
Life Expectancy in Zimbabwe
How long the average person in Zimbabwe is expected to live · sourced from UN WPP 2024
Life expectancy, 1950 to 2100: UN estimates to 2023, projection from 2024
Solid: actual · Dashed: medium-variant projectionZimbabwe population change, 1950 to 2050
Since 1950, Zimbabwe's population has grown by 518.9%.
Zimbabwe has 17.3 million people in 2026, up 231.2% from 5.2 million in 1970.
Births outnumber deaths by 379,320 (UN projection for 2026).
Zimbabwe is projected to grow to 25.9 million people by 2050 (+49.7% from 2026).
Zimbabwe's Demographic Evolution by Decade
In the 2020s, 2024 to 2026 are UN projections.
The population grew 35.0%, from 5.2 million in 1970 to 7.0 million by 1980.
Zimbabwe's demographic transition stage
Stage 3 (falling birth rate): 3.57 children per woman and 29.3 births per 1,000, with a low death rate (7.3). Read more about Stage 3.
The working-age share is still rising, from 53.1% in 2016 to 56.8% in 2026 (dependency ratio 75.9).
Source: UN World Population Prospects 2024 (estimates to 2023, medium-variant projections from 2024).
Compare Zimbabwe with other countries


About this data: UN World Population Prospects 2024, released 11 July 2024. Figures for 2024 and later are medium-variant projections for 1 July. The UN has postponed its next revision from 2026 to 2027 (UN document E/CN.9/2026/CRP.1); these pages will be updated when it is published.
Cite this page: Population Pyramids. (2026). Zimbabwe Population Pyramid and Demographic Analysis. Retrieved from https://www.populationpyramids.org/zimbabwe. View the UN World Population Prospects data