Azerbaijan Population Pyramid (2026)
By Marko Visic · Updated
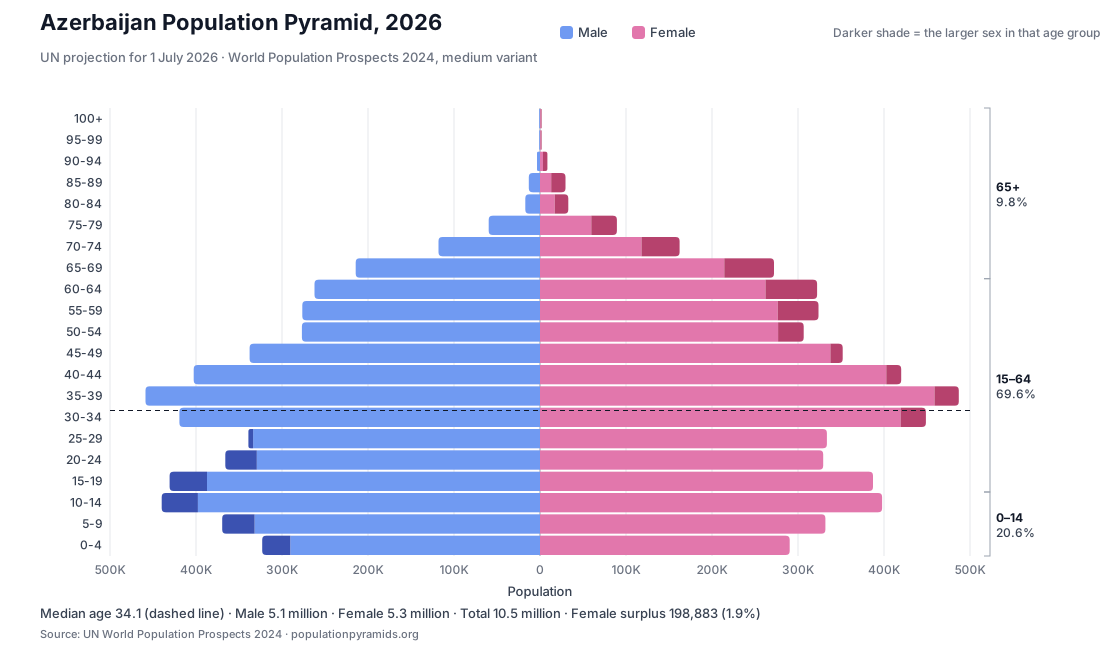
Azerbaijan has a population of 10,454,855 in 2026, according to the UN World Population Prospects 2024 (projection for 1 July). That is the 92nd-largest population in the world and 0.13% of the global total of 8.30 billion. Children under 15 make up 20.6% of the population and people aged 65 and over 9.8%, with 96.3 males for every 100 females.

Show the numbers
| Age group | Male | Female | Total | Share |
|---|---|---|---|---|
| 100+ | 20 | 74 | 94 | 0.00% |
| 95-99 | 448 | 1,245 | 1,693 | 0.02% |
| 90-94 | 3,442 | 8,643 | 12,085 | 0.12% |
| 85-89 | 12,990 | 29,672 | 42,662 | 0.41% |
| 80-84 | 17,149 | 32,851 | 50,000 | 0.48% |
| 75-79 | 59,624 | 89,408 | 149,032 | 1.43% |
| 70-74 | 118,056 | 162,355 | 280,411 | 2.68% |
| 65-69 | 214,279 | 272,128 | 486,407 | 4.65% |
| 60-64 | 262,194 | 322,194 | 584,388 | 5.59% |
| 55-59 | 276,393 | 323,852 | 600,245 | 5.74% |
| 50-54 | 276,823 | 306,622 | 583,445 | 5.58% |
| 45-49 | 337,681 | 351,976 | 689,657 | 6.60% |
| 40-44 | 402,634 | 419,975 | 822,609 | 7.87% |
| 35-39 | 458,701 | 486,974 | 945,675 | 9.05% |
| 30-34 | 419,354 | 448,720 | 868,074 | 8.30% |
| 25-29 | 339,112 | 333,580 | 672,692 | 6.43% |
| 20-24 | 365,904 | 329,349 | 695,253 | 6.65% |
| 15-19 | 430,734 | 387,230 | 817,964 | 7.82% |
| 10-14 | 439,855 | 397,809 | 837,664 | 8.01% |
| 5-9 | 369,586 | 331,864 | 701,450 | 6.71% |
| 0-4 | 323,006 | 290,350 | 613,356 | 5.87% |
| Total | 5,127,986 | 5,326,869 | 10,454,855 | 100.00% |
| Female surplus 198,883 (1.9% of the population). | ||||
Azerbaijan Demographics
Azerbaijan has 10.5 million people in 2026, up 101.7% from 5.2 million in 1970.
Births outnumber deaths by 47,882 (UN projection for 2026).
Median age 34.1 — the 76th-highest of 194 countries.
65+ share 9.8% — the 83rd-highest of 194 countries.
Source: UN World Population Prospects 2024 (estimates to 2023, medium-variant projections from 2024).
Largest generation: Millennials, 26.7% (2,787,247)
All generations in AzerbaijanPopulation pyramid, 1950 to 2026
Watch how Azerbaijan's population structure evolved from 1950 to 2026
Source: UN World Population Prospects 2024 (estimates to 2023, medium-variant projections from 2024).
Page Navigation(Quick jump to sections)
Sex Ratio & Gender Distribution
Azerbaijan has 96.3 males per 100 females (sex ratio)
Women outnumber men by 198,883 (1.9% of the population).
Male Statistics
- Population:5,127,986
- Percentage:49.0%
Female Statistics
- Population:5,326,869
- Percentage:51.0%
Source: UN World Population Prospects 2024 (estimates to 2023, medium-variant projections from 2024).
Birth Statistics & Natality Data
UN World Population Prospects 2024, 2026 (medium-variant projection).
How many births, and how often (2026)
In Azerbaijan there is about one birth every 4.4 minutes.
Birth-rate and fertility trend, 1950 to 2026
Crude birth rate · total fertility rate (dashed)Birth statistics, 2021 to 2026
| Year | Births | Birth rate (per 1,000) | TFR (children/woman) | Type |
|---|---|---|---|---|
| 2021 | 135,569 | 13.2 | 1.71 | estimate |
| 2022 | 129,419 | 12.6 | 1.69 | estimate |
| 2023 | 125,136 | 12.1 | 1.67 | estimate |
| 2024 | 121,322 | 11.7 | 1.67 | projection |
| 2025 | 120,097 | 11.6 | 1.67 | projection |
| 2026 | 119,620 | 11.4 | 1.66 | projection |
Since 1950
Global context (2026)
Source: UN World Population Prospects 2024. Births, birth rate and fertility for 2024 and later are medium-variant projections; 1950–2023 are estimates.
Median Age Analysis
Azerbaijan's median age is 34.1 years
Half the population is younger than 34.1 years and half is older, which makes Azerbaijan a young society.
Source: UN World Population Prospects 2024 (estimates to 2023, medium-variant projections from 2024).
Complete Age Distribution & Youth Demographics
| Age Group | Population | % | Category |
|---|---|---|---|
| 0-4 | 613,356 | 5.9% | Youth |
| 5-9 | 701,450 | 6.7% | Youth |
| 10-14 | 837,664 | 8.0% | Youth |
| 15-19 | 817,964 | 7.8% | Young Adult |
| 20-24 | 695,253 | 6.7% | Young Adult |
| 25-29 | 672,692 | 6.4% | Working Age |
| 30-34 | 868,074 | 8.3% | Working Age |
| 35-39 | 945,675 | 9.0% | Working Age |
| 40-44 | 822,609 | 7.9% | Working Age |
| 45-49 | 689,657 | 6.6% | Working Age |
| 50-54 | 583,445 | 5.6% | Working Age |
| 55-59 | 600,245 | 5.7% | Working Age |
| 60-64 | 584,388 | 5.6% | Working Age |
| 65-69 | 486,407 | 4.7% | Senior |
| 70-74 | 280,411 | 2.7% | Senior |
| 75-79 | 149,032 | 1.4% | Senior |
| 80-84 | 50,000 | 0.5% | Senior |
| 85-89 | 42,662 | 0.4% | Senior |
| 90-94 | 12,085 | 0.1% | Senior |
| 95-99 | 1,693 | 0.0% | Senior |
| 100+ | 94 | 0.0% | Senior |
Source: UN World Population Prospects 2024 (estimates to 2023, medium-variant projections from 2024).
Demographic Transition Model (DTM) Stage
Stage 4 (low birth and death rates): fertility is below the replacement level of 2.1 (1.66 children per woman), and births still exceed deaths (11.4 vs 6.9 per 1,000). Read more about Stage 4 of the Demographic Transition Model.
Source: UN World Population Prospects 2024 (estimates to 2023, medium-variant projections from 2024).
Fertility Rate & Birth Statistics
Azerbaijan Total Fertility Rate: 1.66 children per woman
Below the replacement level of 2.1
Fertility Rate Trends
Historical data (solid line) and future projections (dashed line)
Historical Fertility Trends
| Year | Total Fertility Rate | Birth Rate | Change |
|---|---|---|---|
| 2021 | 1.71 | 13.2 | |
| 2022 | 1.69 | 12.6 | ↓0.02 |
| 2023 | 1.67 | 12.1 | ↓0.02 |
| 2024 | 1.67 | 11.7 | 0.00 |
| 2025 | 1.67 | 11.6 | 0.00 |
| 2026 | 1.66 | 11.4 | ↓0.01 |
Global Context
- World Average: 2.23 children per woman
- Comparison: Below global average
- UN projection for 2030: 1.65
Azerbaijan's total fertility rate is 1.66 children per woman in 2026, below the replacement level of 2.1. Azerbaijan ranks 122 of 194 for fertility rate (1 = highest), in the middle third of countries. Since 1950 the fertility rate has changed by −67.3%.
Historical Demographic Changes
Between 1950 and 2026, Azerbaijan's population grew by 233.8%.
The median age rose from 20.2 in 1950 to 34.1 in 2026.
Source: UN World Population Prospects 2024 (estimates to 2023, medium-variant projections from 2024).
Understanding Azerbaijan's Demographics
Azerbaijan has a stationary population pyramid: similar-sized bands from the youngest cohorts through the working ages.
Children under 15 make up 20.6% of the population and people aged 65 and over 9.8%.
The largest five-year age band is 35–39, at 9.0% of the population, compared with 5.9% in the 0–4 band.
Source: UN World Population Prospects 2024 (estimates to 2023, medium-variant projections from 2024).
Demographic Analysis: Azerbaijan's Population Structure
Demographic Dividend Window
Azerbaijan's working-age share peaked in 2011 at 72.1% and is 69.6% in 2026.
Fertility Transition Stage
Azerbaijan's total fertility rate is 1.66 children per woman (2026, UN WPP 2024), which is below replacement.
Population Aging Speed
Azerbaijan's median age changed by +4.2 years from 2016 to 2026, faster than the world average (+2.6 years).
Source: UN World Population Prospects 2024 (estimates to 2023, medium-variant projections from 2024).
Key Demographics
| Total Population | 10,454,855 |
| Male Population | 5,127,986(49.0%) |
| Female Population | 5,326,869(51.0%) |
| Median Age | 34.1 years |
| Sex Ratio | 96.3 males per 100 females |
| Youth (0-14) | 2,152,470(20.6%) |
| Working Age (15-64) | 7,280,001(69.6%) |
| Elderly (65+) | 1,022,384(9.8%) |
| Total Dependency Ratio | 43.6 |
| Youth Dependency Ratio | 29.6 |
| Old Age Dependency Ratio | 14.0 |
| Pyramid Type | Stationary |
Dependency Ratios: Number of dependents per 100 working-age individuals.
Demographic Data Visualizations
Total population, 1950–2026 (UN WPP 2024; 2024 onward are projections).
Median age, 1950–2026 (UN WPP 2024; 2024 onward are projections).
Youth, working-age and elderly shares, 1950 vs 2026 (UN WPP 2024).
Age distribution in 2026: youth, working-age and elderly shares (UN WPP 2024; projection).
Life Expectancy in Azerbaijan
How long the average person in Azerbaijan is expected to live · sourced from UN WPP 2024
Life expectancy, 1950 to 2100: UN estimates to 2023, projection from 2024
Solid: actual · Dashed: medium-variant projectionFuture Demographic Trends
Azerbaijan is projected to grow to 11.2 million people by 2050 (+7.4% from 2026).
The median age rises from 34.1 in 2026 to 39.7 by 2050.
Source: UN World Population Prospects 2024 (estimates to 2023, medium-variant projections from 2024).
Azerbaijan's Demographic Evolution by Decade
In the 2020s, 2024 to 2026 are UN projections.
The population grew 21.2%, from 5.2 million in 1970 to 6.3 million by 1980
Median age increased by 3.3 years
The youth population share contracted by 9.9 percentage points.
Key Demographic Highlights
- Population changed from 5.2M to 6.3M
- Growth rate of 21.2% over the decade
- Median age shifted from 16.4 to 19.7 years (+3.3y)
- 65+ share changed by −0.3 points; under-15 share by −9.9 points
Frequently Asked Questions About Azerbaijan
How does Azerbaijan rank globally by population?
Azerbaijan ranks 92nd in the world by population with 10.5 million people as of 2026, representing 0.13% of the global total of 8.30 billion.
What does Azerbaijan's age structure reveal about its development?
With 20.6% under 15, 69.6% working-age (15–64) and 9.8% aged 65+, Azerbaijan's age structure is that of a country in Stage 4 of the demographic transition, with a stationary population pyramid. The median age is 34.1 years.
What is the dependency ratio in Azerbaijan?
Azerbaijan has 43.6 people under 15 or aged 65+ per 100 people aged 15–64 in 2026.
Is Azerbaijan experiencing a demographic dividend?
Azerbaijan has moved past its demographic-dividend window. Azerbaijan's working-age share peaked in 2011 at 72.1% and is 69.6% in 2026. A demographic dividend occurs when falling fertility creates a bulge in the working-age population while dependency ratios stay manageable.
What are the gender dynamics in Azerbaijan's population?
Azerbaijan has more females than males, with 96.3 males per 100 females.
Source: UN World Population Prospects 2024 (estimates to 2023, medium-variant projections from 2024).
Compare with Other Countries


About this data: UN World Population Prospects 2024, released 11 July 2024. Figures for 2024 and later are medium-variant projections for 1 July. The UN has postponed its next revision from 2026 to 2027 (UN document E/CN.9/2026/CRP.1); these pages will be updated when it is published.
Data Sources & Methodology
All population data is sourced from the United Nations Department of Economic and Social Affairs, Population Division. Figures up to 2023 are UN estimates; 2024 and later are medium-variant projections.
Cite this page: Population Pyramids. (2026). Azerbaijan Population Pyramid and Demographic Analysis. Retrieved from https://www.populationpyramids.org/azerbaijan
View UN World Population Prospects data