Stage 4 Population Pyramid: The Low Stationary Stage
By Marko Visic · Updated
In Stage 4, births and deaths are both low. Fertility has slipped below replacement, yet deaths have not yet overtaken births.
In Stage 4, low stationary, fertility is below the replacement level of 2.1 children per woman but deaths still do not outnumber births, so growth is slow. By the UN’s 2026 projections, 63 countries are in Stage 4, about 45.2% of the world’s people, the largest share of any stage.
What puts a country in Stage 4
A Stage 4 country has low births and low deaths, so growth is low. Its pyramid is roughly columnar, with similar widths from the base to middle age. The dividing line from Stage 3 is the replacement level of 2.1 children per woman; the dividing line from Stage 5 is whether deaths have begun to outnumber births.
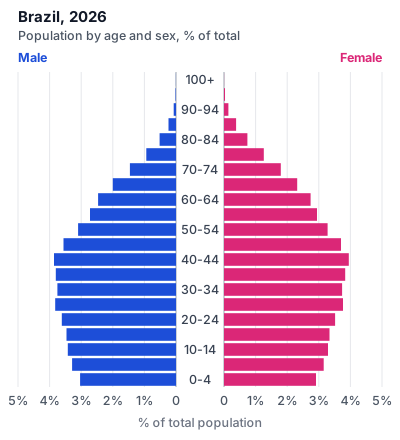
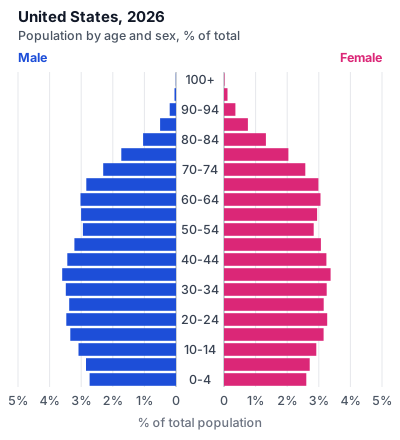
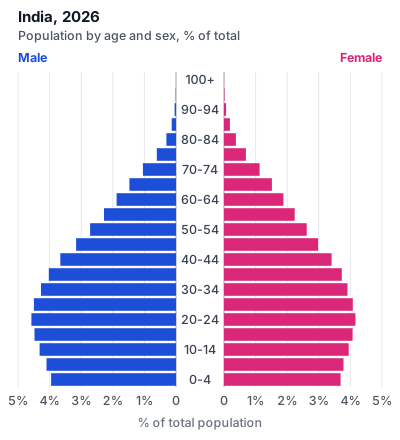
Every Stage 4 country in 2026
These 63 countries meet the Stage 4 conditions in 2026, sorted by population. Each country’s figures match its own page.
| Country | Population (2026) | Births /1,000 | Deaths /1,000 | Natural change /1,000 | Children per woman |
|---|---|---|---|---|---|
| India | 1,476,625,577 | 15.6 | 6.7 | +8.9 | 1.93 |
| United States | 349,035,494 | 10.5 | 9.0 | +1.5 | 1.63 |
| Indonesia | 287,886,783 | 15.4 | 7.8 | +7.6 | 2.08 |
| Brazil | 213,562,666 | 11.7 | 7.3 | +4.4 | 1.59 |
| Bangladesh | 177,818,045 | 19.2 | 5.1 | +14.1 | 2.09 |
| Mexico | 132,997,657 | 15.0 | 6.3 | +8.7 | 1.85 |
| Philippines | 117,724,471 | 15.7 | 6.6 | +9.1 | 1.86 |
| Vietnam | 102,177,430 | 12.8 | 6.8 | +6.0 | 1.86 |
| Iran | 93,168,497 | 11.8 | 4.9 | +6.9 | 1.66 |
| Turkey | 87,926,082 | 11.9 | 6.4 | +5.5 | 1.62 |
| United Kingdom | 69,931,529 | 9.7 | 9.7 | 0.0 | 1.53 |
| France | 66,746,401 | 9.5 | 9.5 | 0.0 | 1.64 |
| Myanmar | 55,184,818 | 16.0 | 9.3 | +6.7 | 2.06 |
| Colombia | 53,936,226 | 12.7 | 5.6 | +7.1 | 1.61 |
| Argentina | 46,003,734 | 11.1 | 7.9 | +3.2 | 1.51 |
| Canada | 40,467,727 | 8.9 | 8.2 | +0.7 | 1.33 |
| Malaysia | 36,385,114 | 12.1 | 5.5 | +6.6 | 1.52 |
| Peru | 34,922,147 | 15.3 | 5.7 | +9.6 | 1.93 |
| Nepal | 29,629,410 | 18.3 | 7.0 | +11.3 | 1.92 |
| Venezuela | 28,633,711 | 15.4 | 7.9 | +7.5 | 2.04 |
| Australia | 27,227,096 | 11.1 | 6.9 | +4.2 | 1.64 |
| North Korea | 26,633,691 | 12.3 | 10.1 | +2.2 | 1.75 |
| Sri Lanka | 23,348,314 | 13.6 | 7.3 | +6.3 | 1.93 |
| Chile | 19,945,849 | 8.5 | 6.8 | +1.7 | 1.12 |
| Netherlands | 18,448,776 | 9.5 | 9.3 | +0.2 | 1.44 |
| Ecuador | 18,444,506 | 14.5 | 5.3 | +9.2 | 1.78 |
| Tunisia | 12,415,138 | 12.6 | 6.3 | +6.3 | 1.79 |
| United Arab Emirates | 11,574,683 | 10.3 | 1.0 | +9.3 | 1.21 |
| Azerbaijan | 10,454,855 | 11.4 | 6.9 | +4.5 | 1.66 |
| Switzerland | 9,007,798 | 9.0 | 8.5 | +0.5 | 1.45 |
| El Salvador | 6,391,253 | 15.2 | 7.5 | +7.7 | 1.74 |
| Denmark | 6,023,520 | 9.9 | 9.8 | +0.1 | 1.52 |
| Singapore | 5,905,748 | 8.6 | 5.2 | +3.4 | 0.97 |
| Norway | 5,652,988 | 9.4 | 7.8 | +1.6 | 1.42 |
| Ireland | 5,356,950 | 9.8 | 7.0 | +2.8 | 1.60 |
| New Zealand | 5,287,479 | 11.0 | 7.6 | +3.4 | 1.64 |
| Costa Rica | 5,174,790 | 9.7 | 5.8 | +3.9 | 1.31 |
| Kuwait | 5,102,773 | 9.7 | 1.8 | +7.9 | 1.49 |
| Panama | 4,625,717 | 15.5 | 5.0 | +10.5 | 2.07 |
| Qatar | 3,173,560 | 9.7 | 1.0 | +8.7 | 1.69 |
| Armenia | 2,930,915 | 11.5 | 9.5 | +2.0 | 1.71 |
| Jamaica | 2,833,403 | 11.1 | 8.5 | +2.6 | 1.33 |
| Albania | 2,751,024 | 9.7 | 8.8 | +0.9 | 1.32 |
| Bahrain | 1,675,572 | 11.9 | 2.2 | +9.7 | 1.77 |
| Trinidad and Tobago | 1,513,268 | 10.1 | 9.2 | +0.9 | 1.52 |
| Cyprus | 1,382,334 | 9.9 | 7.1 | +2.8 | 1.37 |
| Bhutan | 802,215 | 12.2 | 6.0 | +6.2 | 1.43 |
| Luxembourg | 687,449 | 10.1 | 7.4 | +2.7 | 1.41 |
| Maldives | 531,517 | 9.8 | 2.5 | +7.3 | 1.53 |
| Cabo Verde | 529,630 | 12.0 | 5.2 | +6.8 | 1.49 |
| Brunei | 469,774 | 12.7 | 5.6 | +7.1 | 1.70 |
| Belize | 428,645 | 17.4 | 5.1 | +12.3 | 1.99 |
| Bahamas | 404,628 | 10.5 | 9.0 | +1.5 | 1.36 |
| Iceland | 402,329 | 10.8 | 6.7 | +4.1 | 1.49 |
| Barbados | 282,724 | 11.0 | 10.4 | +0.6 | 1.71 |
| Saint Lucia | 180,488 | 10.9 | 8.9 | +2.0 | 1.37 |
| Seychelles | 134,959 | 13.2 | 8.1 | +5.1 | 2.06 |
| Grenada | 117,362 | 11.0 | 9.0 | +2.0 | 1.45 |
| Saint Vincent and the Grenadines | 99,244 | 11.7 | 11.6 | +0.1 | 1.73 |
| Antigua and Barbuda | 94,625 | 11.4 | 7.2 | +4.2 | 1.57 |
| Andorra | 83,753 | 6.9 | 6.3 | +0.6 | 1.11 |
| Saint Kitts and Nevis | 46,992 | 11.2 | 10.1 | +1.1 | 1.50 |
| Liechtenstein | 40,368 | 9.2 | 8.1 | +1.1 | 1.54 |
Population is a UN projection for 1 July 2026 (World Population Prospects 2024, medium variant).
A clear Stage 4 country in detail
- Population
- 213,562,666
- Births /1,000
- 11.7
- Deaths /1,000
- 7.3
- Natural change /1,000
- +4.4
- Children per woman
- 1.59
- Median age
- 35.3
- Under 15
- 19.1%
- 65 and older
- 11.9%
We place each country by its 2026 UN projections: Stage 5 if deaths exceed births; otherwise Stage 4 if women have fewer than 2.1 children on average; otherwise Stage 2 if there are at least 30 births per 1,000 people; otherwise Stage 3. No country meets the conditions of Stage 1 today.
Below replacement but still growing
Fertility below replacement does not mean a country is shrinking. In every Stage 4 country births at least match deaths, and in the three countries below migration adds more on top. The table shows natural change (births minus deaths) next to net migration, both per 1,000 people in the UN’s 2026 projections (World Population Prospects 2024); the two together are why these populations keep growing.
| Country | Natural change /1,000 | Net migration /1,000 |
|---|---|---|
| United States | +1.5 | +3.4 |
| Australia | +4.2 | +4.8 |
| Canada | +0.7 | +7.2 |
Close to Stage 5
In the same UN projections for 2026, 11 Stage 4 countries have a natural change under +1.0 per 1,000, close to the point where deaths start to outnumber births and they would move into Stage 5:
- United Kingdom (0.0 per 1,000)
- France (0.0 per 1,000)
- Saint Vincent and the Grenadines (+0.1 per 1,000)
- Denmark (+0.1 per 1,000)
- Netherlands (+0.2 per 1,000)
- Switzerland (+0.5 per 1,000)
- Andorra (+0.6 per 1,000)
- Barbados (+0.6 per 1,000)
- Canada (+0.7 per 1,000)
- Albania (+0.9 per 1,000)
- Trinidad and Tobago (+0.9 per 1,000)
Figures are rounded to one decimal; the stage rule uses the unrounded values, so the United Kingdom and France sit just above zero even though they display as 0.0.
Stage 4 between growth and decline
Stage 4 follows Stage 3, late expanding, and can tip into Stage 5, declining, once deaths overtake births. The four-stage vs five-stage debate is about whether that final step counts as its own stage.
Frequently asked questions
Which countries are in Stage 4?
By 2026 UN projections, 63 countries are in Stage 4, about 45.2% of the world's people, the largest share of any stage. They have fertility below the replacement level of 2.1 children per woman, but births still outnumber deaths.
Is the United States in Stage 4?
Yes. The United States has 10.5 births and 9.0 deaths per 1,000 in 2026, with 1.63 children per woman, below replacement, but births still outnumber deaths.
Is India in Stage 4?
Yes. India's fertility is 1.93 children per woman in 2026, just below the replacement level of 2.1, with births (15.6 per 1,000) still well above deaths (6.7).
Is Canada in Stage 4?
Yes, but close to the boundary with Stage 5: Canada's natural change is only +0.7 per 1,000 in 2026 (8.9 births, 8.2 deaths), with 1.33 children per woman. A little lower and deaths would outnumber births.
What does a Stage 4 population pyramid look like?
Roughly columnar: similar widths from the base to middle age, widening at the top as more people reach old age. Brazil is an example, with 1.59 children per woman and 11.7 births per 1,000.
Sources
- United Nations, Department of Economic and Social Affairs, Population Division (2024), World Population Prospects 2024, https://population.un.org/wpp/.