Greece Population Pyramid (2026)
By Marko Visic · Updated
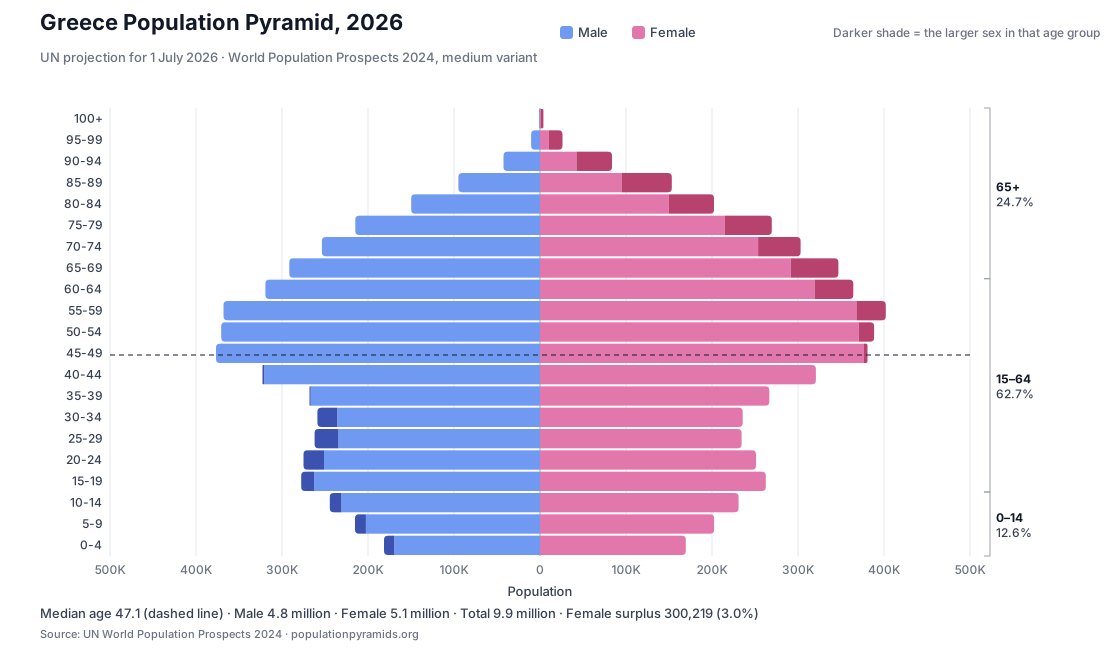
Greece has a population of 9,897,115 in 2026, according to the UN World Population Prospects 2024 (projection for 1 July). That is the 95th-largest population in the world and 0.12% of the global total of 8.30 billion. Children under 15 make up 12.6% of the population and people aged 65 and over 24.7%, with 94.1 males for every 100 females.

Show the numbers
| Age group | Male | Female | Total | Share |
|---|---|---|---|---|
| 100+ | 1,046 | 3,933 | 4,979 | 0.05% |
| 95-99 | 10,346 | 26,140 | 36,486 | 0.37% |
| 90-94 | 42,471 | 83,678 | 126,149 | 1.27% |
| 85-89 | 94,874 | 153,218 | 248,092 | 2.51% |
| 80-84 | 149,755 | 202,304 | 352,059 | 3.56% |
| 75-79 | 214,733 | 269,563 | 484,296 | 4.89% |
| 70-74 | 253,591 | 303,043 | 556,634 | 5.62% |
| 65-69 | 291,477 | 346,927 | 638,404 | 6.45% |
| 60-64 | 319,345 | 364,330 | 683,675 | 6.91% |
| 55-59 | 368,022 | 402,099 | 770,121 | 7.78% |
| 50-54 | 370,750 | 388,520 | 759,270 | 7.67% |
| 45-49 | 376,761 | 380,822 | 757,583 | 7.65% |
| 40-44 | 322,692 | 320,819 | 643,511 | 6.50% |
| 35-39 | 268,032 | 266,589 | 534,621 | 5.40% |
| 30-34 | 258,870 | 235,714 | 494,584 | 5.00% |
| 25-29 | 262,098 | 234,408 | 496,506 | 5.02% |
| 20-24 | 275,030 | 251,169 | 526,199 | 5.32% |
| 15-19 | 277,650 | 262,606 | 540,256 | 5.46% |
| 10-14 | 244,423 | 230,883 | 475,306 | 4.80% |
| 5-9 | 215,138 | 202,414 | 417,552 | 4.22% |
| 0-4 | 181,344 | 169,488 | 350,832 | 3.54% |
| Total | 4,798,448 | 5,098,667 | 9,897,115 | 100.00% |
| Female surplus 300,219 (3.0% of the population). | ||||
Greece Demographics
Greece has 9.9 million people in 2026, up 13.1% from 8.7 million in 1970.
Deaths outnumber births by 57,576 (UN projection for 2026).
65+ share 24.7% — the 5th-highest of 194 countries.
Median age 47.1 — the 6th-highest of 194 countries.
Source: UN World Population Prospects 2024 (estimates to 2023, medium-variant projections from 2024).
Largest generation: Gen X, 24.5% (2,428,290)
All generations in Greece

Population pyramid, 1950 to 2026
Watch how Greece's population structure evolved from 1950 to 2026
Source: UN World Population Prospects 2024 (estimates to 2023, medium-variant projections from 2024).
Page Navigation(Quick jump to sections)
Sex Ratio & Gender Distribution
Greece has 94.1 males per 100 females (sex ratio)
Women outnumber men by 300,219 (3.0% of the population).
Male Statistics
- Population:4,798,448
- Percentage:48.5%
Female Statistics
- Population:5,098,667
- Percentage:51.5%
Source: UN World Population Prospects 2024 (estimates to 2023, medium-variant projections from 2024).
Birth Statistics & Natality Data
UN World Population Prospects 2024, 2026 (medium-variant projection).
How many births, and how often (2026)
In Greece there is about one birth every 7.8 minutes.
Birth-rate and fertility trend, 1950 to 2026
Crude birth rate · total fertility rate (dashed)Birth statistics, 2021 to 2026
| Year | Births | Birth rate (per 1,000) | TFR (children/woman) | Type |
|---|---|---|---|---|
| 2021 | 86,163 | 8.1 | 1.43 | estimate |
| 2022 | 74,165 | 7.1 | 1.31 | estimate |
| 2023 | 73,661 | 7.2 | 1.33 | estimate |
| 2024 | 71,411 | 7.1 | 1.34 | projection |
| 2025 | 68,148 | 6.9 | 1.34 | projection |
| 2026 | 67,361 | 6.8 | 1.34 | projection |
Since 1950
Global context (2026)
Source: UN World Population Prospects 2024. Births, birth rate and fertility for 2024 and later are medium-variant projections; 1950–2023 are estimates.
Median Age Analysis
Greece's median age is 47.1 years
Half the population is younger than 47.1 years and half is older, which makes Greece an aging society.
Source: UN World Population Prospects 2024 (estimates to 2023, medium-variant projections from 2024).
Complete Age Distribution & Youth Demographics
| Age Group | Population | % | Category |
|---|---|---|---|
| 0-4 | 350,832 | 3.5% | Youth |
| 5-9 | 417,552 | 4.2% | Youth |
| 10-14 | 475,306 | 4.8% | Youth |
| 15-19 | 540,256 | 5.5% | Young Adult |
| 20-24 | 526,199 | 5.3% | Young Adult |
| 25-29 | 496,506 | 5.0% | Working Age |
| 30-34 | 494,584 | 5.0% | Working Age |
| 35-39 | 534,621 | 5.4% | Working Age |
| 40-44 | 643,511 | 6.5% | Working Age |
| 45-49 | 757,583 | 7.7% | Working Age |
| 50-54 | 759,270 | 7.7% | Working Age |
| 55-59 | 770,121 | 7.8% | Working Age |
| 60-64 | 683,675 | 6.9% | Working Age |
| 65-69 | 638,404 | 6.5% | Senior |
| 70-74 | 556,634 | 5.6% | Senior |
| 75-79 | 484,296 | 4.9% | Senior |
| 80-84 | 352,059 | 3.6% | Senior |
| 85-89 | 248,092 | 2.5% | Senior |
| 90-94 | 126,149 | 1.3% | Senior |
| 95-99 | 36,486 | 0.4% | Senior |
| 100+ | 4,979 | 0.1% | Senior |
Source: UN World Population Prospects 2024 (estimates to 2023, medium-variant projections from 2024).
Demographic Transition Model (DTM) Stage
Stage 5 (natural decrease): deaths outnumber births — 6.8 births and 12.6 deaths per 1,000 people in 2026. Read more about Stage 5 of the Demographic Transition Model.
Source: UN World Population Prospects 2024 (estimates to 2023, medium-variant projections from 2024).
Fertility Rate & Birth Statistics
Greece Total Fertility Rate: 1.34 children per woman
Below the replacement level of 2.1
Fertility Rate Trends
Historical data (solid line) and future projections (dashed line)
Historical Fertility Trends
| Year | Total Fertility Rate | Birth Rate | Change |
|---|---|---|---|
| 2021 | 1.43 | 8.1 | |
| 2022 | 1.31 | 7.1 | ↓0.12 |
| 2023 | 1.33 | 7.2 | ↑0.02 |
| 2024 | 1.34 | 7.1 | ↑0.01 |
| 2025 | 1.34 | 6.9 | 0.00 |
| 2026 | 1.34 | 6.8 | 0.00 |
Global Context
- World Average: 2.23 children per woman
- Comparison: Below global average
- UN projection for 2030: 1.36
Greece's total fertility rate is 1.34 children per woman in 2026, below the replacement level of 2.1. Greece ranks 171 of 194 for fertility rate (1 = highest), in the lowest third of countries. Since 1950 the fertility rate has changed by −47.9%.
Historical Demographic Changes
Between 1950 and 2026, Greece's population grew by 29.4%.
The median age rose from 24.6 in 1950 to 47.1 in 2026.
Source: UN World Population Prospects 2024 (estimates to 2023, medium-variant projections from 2024).
Understanding Greece's Demographics
Greece has a constrictive population pyramid: a base narrower than the middle, so younger cohorts are smaller than the ones above them.
Children under 15 make up 12.6% of the population and people aged 65 and over 24.7%.
The largest five-year age band is 55–59, at 7.8% of the population, compared with 3.5% in the 0–4 band.
Source: UN World Population Prospects 2024 (estimates to 2023, medium-variant projections from 2024).
Demographic Analysis: Greece's Population Structure
Demographic Dividend Window
Greece's working-age share peaked in 1998 at 67.3% and is 62.7% in 2026.
Fertility Transition Stage
Greece's total fertility rate is 1.34 children per woman (2026, UN WPP 2024), which is below replacement.
Population Aging Speed
Greece's median age changed by +4.0 years from 2016 to 2026, faster than the world average (+2.6 years).
Source: UN World Population Prospects 2024 (estimates to 2023, medium-variant projections from 2024).
Key Demographics
| Total Population | 9,897,115 |
| Male Population | 4,798,448(48.5%) |
| Female Population | 5,098,667(51.5%) |
| Median Age | 47.1 years |
| Sex Ratio | 94.1 males per 100 females |
| Youth (0-14) | 1,243,690(12.6%) |
| Working Age (15-64) | 6,206,326(62.7%) |
| Elderly (65+) | 2,447,099(24.7%) |
| Total Dependency Ratio | 59.5 |
| Youth Dependency Ratio | 20.0 |
| Old Age Dependency Ratio | 39.4 |
| Pyramid Type | Constrictive |
Dependency Ratios: Number of dependents per 100 working-age individuals.
Demographic Data Visualizations
Total population, 1950–2026 (UN WPP 2024; 2024 onward are projections).
Median age, 1950–2026 (UN WPP 2024; 2024 onward are projections).
Youth, working-age and elderly shares, 1950 vs 2026 (UN WPP 2024).
Age distribution in 2026: youth, working-age and elderly shares (UN WPP 2024; projection).
Life Expectancy in Greece
How long the average person in Greece is expected to live · sourced from UN WPP 2024
Life expectancy, 1950 to 2100: UN estimates to 2023, projection from 2024
Solid: actual · Dashed: medium-variant projectionFuture Demographic Trends
Greece is projected to shrink to 8.8 million people by 2050 (−11.0% from 2026).
The median age rises from 47.1 in 2026 to 49.9 by 2050.
Source: UN World Population Prospects 2024 (estimates to 2023, medium-variant projections from 2024).
Greece's Demographic Evolution by Decade
In the 2020s, 2024 to 2026 are UN projections.
The population grew 10.4%, from 8.7 million in 1970 to 9.7 million by 1980
The youth population share contracted by 1.4 percentage points
Meanwhile, the elderly population proportion grew by 2.2 percentage points.
Key Demographic Highlights
- Population changed from 8.7M to 9.7M
- Growth rate of 10.4% over the decade
- Median age shifted from 32.3 to 32.8 years (+0.5y)
- 65+ share changed by +2.2 points; under-15 share by −1.4 points
How Does Greece Compare to Its Neighbors?
Greece has a younger population than Italy. Greece has an older population than Germany, France and the United Kingdom.
Greece
Germany
France
United Kingdom
Italy
| Country | Population | Median Age | Youth % | Elderly % | Pyramid Type |
|---|---|---|---|---|---|
| Greece (Current) | 9,897,115 | 47.1 | 12.6% | 24.7% | constrictive |
| Germany | 83,644,259 | 45.7 | 13.9% | 24.2% | constrictive |
| France | 66,746,401 | 42.5 | 16.0% | 22.9% | constrictive |
| United Kingdom | 69,931,529 | 40.2 | 16.7% | 19.9% | constrictive |
| Italy | 58,926,167 | 48.6 | 11.4% | 25.6% | constrictive |
Source: UN World Population Prospects 2024 (estimates to 2023, medium-variant projections from 2024).
Frequently Asked Questions About Greece
How does Greece rank globally by population?
Greece ranks 95th in the world by population with 9.90 million people as of 2026, representing 0.12% of the global total of 8.30 billion.
What does Greece's age structure reveal about its development?
With 12.6% under 15, 62.7% working-age (15–64) and 24.7% aged 65+, Greece's age structure is that of a country in Stage 5 of the demographic transition, with a constrictive population pyramid. The median age is 47.1 years.
What is the dependency ratio in Greece?
Greece has 59.5 people under 15 or aged 65+ per 100 people aged 15–64 in 2026.
Is Greece experiencing a demographic dividend?
Greece has moved past its demographic-dividend window. Greece's working-age share peaked in 1998 at 67.3% and is 62.7% in 2026. A demographic dividend occurs when falling fertility creates a bulge in the working-age population while dependency ratios stay manageable.
What are the gender dynamics in Greece's population?
Greece has more females than males, with 94.1 males per 100 females.
Source: UN World Population Prospects 2024 (estimates to 2023, medium-variant projections from 2024).
Compare with Other Countries


About this data: UN World Population Prospects 2024, released 11 July 2024. Figures for 2024 and later are medium-variant projections for 1 July. The UN has postponed its next revision from 2026 to 2027 (UN document E/CN.9/2026/CRP.1); these pages will be updated when it is published.
Data Sources & Methodology
All population data is sourced from the United Nations Department of Economic and Social Affairs, Population Division. Figures up to 2023 are UN estimates; 2024 and later are medium-variant projections.
Cite this page: Population Pyramids. (2026). Greece Population Pyramid and Demographic Analysis. Retrieved from https://www.populationpyramids.org/greece
View UN World Population Prospects data