Stage 5 Population Pyramid: The Declining Stage
By Marko Visic · Updated
Stage 5 is the point where deaths outnumber births and a country’s population starts to fall on its own.
In Stage 5, declining, deaths outnumber births, so the population shrinks without migration. By the UN’s 2026 projections, 41 countries are in Stage 5, about 26.9% of the world’s people.
What tips a country into Stage 5
A Stage 5 country has low births and deaths that are now above births, so growth is negative (natural decrease). Its pyramid is a narrow base, widest through the middle and older-middle ages, with many older people. The single test is whether deaths outnumber births; when they do, natural change turns negative.
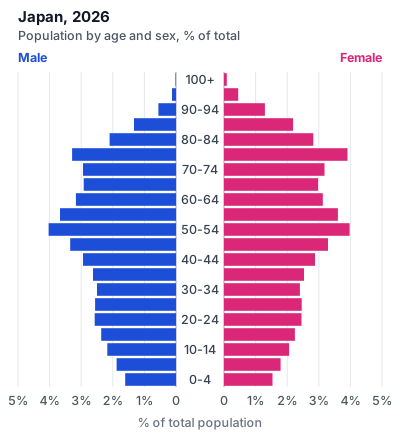
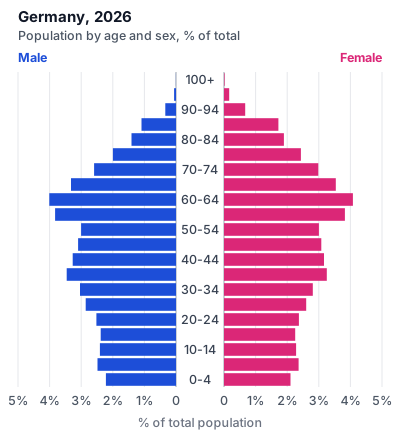
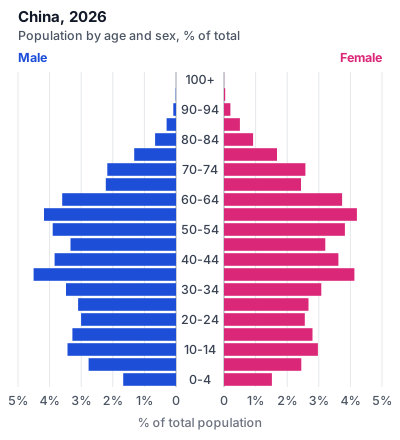
Every Stage 5 country in 2026
These 41 countries meet the Stage 5 condition in 2026, sorted by population. Each country’s figures match its own page.
| Country | Population (2026) | Births /1,000 | Deaths /1,000 | Natural change /1,000 | Children per woman |
|---|---|---|---|---|---|
| China | 1,412,914,088 | 6.1 | 8.1 | −2.0 | 1.03 |
| Russia | 143,394,458 | 8.5 | 13.0 | −4.5 | 1.47 |
| Japan | 122,427,731 | 6.1 | 12.8 | −6.7 | 1.23 |
| Germany | 83,644,259 | 8.2 | 12.5 | −4.3 | 1.46 |
| Thailand | 71,559,615 | 7.9 | 9.3 | −1.4 | 1.19 |
| Italy | 58,926,167 | 6.4 | 11.4 | −5.0 | 1.22 |
| South Korea | 51,600,388 | 4.8 | 7.5 | −2.7 | 0.76 |
| Spain | 47,850,792 | 6.8 | 9.6 | −2.8 | 1.24 |
| Ukraine | 39,535,848 | 6.1 | 13.3 | −7.2 | 1.00 |
| Poland | 37,843,189 | 7.5 | 11.1 | −3.6 | 1.31 |
| Romania | 18,800,604 | 9.4 | 13.6 | −4.2 | 1.71 |
| Belgium | 11,774,643 | 8.6 | 9.8 | −1.2 | 1.40 |
| Cuba | 10,892,659 | 8.5 | 10.6 | −2.1 | 1.46 |
| Sweden | 10,701,046 | 9.0 | 9.1 | −0.1 | 1.45 |
| Czech Republic | 10,527,780 | 7.9 | 11.2 | −3.3 | 1.47 |
| Portugal | 10,395,363 | 8.2 | 11.4 | −3.2 | 1.52 |
| Greece | 9,897,115 | 6.8 | 12.6 | −5.8 | 1.34 |
| Hungary | 9,585,818 | 8.7 | 13.4 | −4.7 | 1.50 |
| Austria | 9,107,265 | 8.2 | 10.3 | −2.1 | 1.34 |
| Belarus | 8,937,018 | 6.9 | 13.3 | −6.4 | 1.23 |
| Bulgaria | 6,667,660 | 8.9 | 15.3 | −6.4 | 1.74 |
| Serbia | 6,641,964 | 8.6 | 14.3 | −5.7 | 1.51 |
| Finland | 5,621,738 | 7.8 | 10.9 | −3.1 | 1.30 |
| Slovakia | 5,451,341 | 8.8 | 10.5 | −1.7 | 1.57 |
| Croatia | 3,822,344 | 8.0 | 14.0 | −6.0 | 1.47 |
| Georgia | 3,804,642 | 10.9 | 11.8 | −0.9 | 1.78 |
| Uruguay | 3,382,537 | 9.7 | 10.0 | −0.3 | 1.38 |
| Bosnia and Herzegovina | 3,114,242 | 7.7 | 13.7 | −6.0 | 1.50 |
| Moldova | 2,961,254 | 10.1 | 14.2 | −4.1 | 1.72 |
| Lithuania | 2,797,338 | 7.7 | 14.2 | −6.5 | 1.22 |
| Slovenia | 2,114,574 | 8.0 | 10.5 | −2.5 | 1.58 |
| Latvia | 1,835,934 | 7.3 | 14.8 | −7.5 | 1.35 |
| North Macedonia | 1,804,063 | 8.9 | 11.3 | −2.4 | 1.47 |
| Estonia | 1,331,062 | 7.6 | 12.4 | −4.8 | 1.38 |
| Mauritius | 1,265,058 | 8.9 | 9.4 | −0.5 | 1.21 |
| Montenegro | 626,233 | 10.7 | 11.6 | −0.9 | 1.79 |
| Malta | 549,011 | 7.7 | 7.9 | −0.2 | 1.12 |
| Dominica | 65,510 | 10.7 | 12.4 | −1.7 | 1.46 |
| Monaco | 38,087 | 9.7 | 18.8 | −9.1 | 2.09 |
| San Marino | 33,605 | 5.8 | 8.7 | −2.9 | 1.17 |
| Palau | 17,615 | 10.5 | 12.2 | −1.7 | 1.84 |
Population is a UN projection for 1 July 2026 (World Population Prospects 2024, medium variant).
Where Stage 5 leads: 2050 and 2100
Sustained natural decrease compounds. The UN’s medium-variant projections show the Stage 5 examples losing population over the rest of the century (total population, millions of people):
| Country | 2026 | 2050 | 2100 |
|---|---|---|---|
| Japan | 122,427,731 | 105,123,167 | 76,845,990 |
| Germany | 83,644,259 | 78,294,612 | 70,899,863 |
| China | 1,412,914,088 | 1,260,289,093 | 633,368,112 |
A clear Stage 5 country examined
- Population
- 122,427,731
- Births /1,000
- 6.1
- Deaths /1,000
- 12.8
- Natural change /1,000
- −6.7
- Children per woman
- 1.23
- Median age
- 50.2
- Under 15
- 11.0%
- 65 and older
- 30.2%
We place each country by its 2026 UN projections: Stage 5 if deaths exceed births; otherwise Stage 4 if women have fewer than 2.1 children on average; otherwise Stage 2 if there are at least 30 births per 1,000 people; otherwise Stage 3. No country meets the conditions of Stage 1 today.
Is Stage 5 really a separate stage?
Stage 5 follows Stage 4, low stationary. Not every version of the model includes it; that is the subject of the four-stage vs five-stage comparison. See all five stages for the full sequence.
Frequently asked questions
Which countries are in Stage 5?
By 2026 UN projections, 41 countries are in Stage 5, about 26.9% of the world's people, across East Asia, Europe and beyond. In each, deaths outnumber births.
Is Japan in Stage 5?
Yes. Japan has 6.1 births and 12.8 deaths per 1,000 in 2026, a natural change of −6.7 per 1,000 and 1.23 children per woman: more deaths than births, the mark of Stage 5.
Is South Korea in Stage 5?
Yes. South Korea has 4.8 births and 7.5 deaths per 1,000 in 2026, a natural change of −2.7 per 1,000, with just 0.76 children per woman.
Is Russia in Stage 5?
Yes. Russia has 8.5 births and 13.0 deaths per 1,000 in 2026, a natural change of −4.5 per 1,000 and 1.47 children per woman.
Is China in Stage 5?
Yes. China crossed into natural decline: 6.1 births and 8.1 deaths per 1,000 in 2026, a natural change of −2.0 per 1,000, with 1.03 children per woman.
What does a Stage 5 population pyramid look like?
A narrow base, widest through the middle and older-middle ages, with many older people: an outline that is top-heavy rather than triangular. Japan is an example, with 1.23 children per woman.
Sources
- United Nations, Department of Economic and Social Affairs, Population Division (2024), World Population Prospects 2024, https://population.un.org/wpp/.