Europe Population Pyramid, 2026
By Marko Visic · Updated
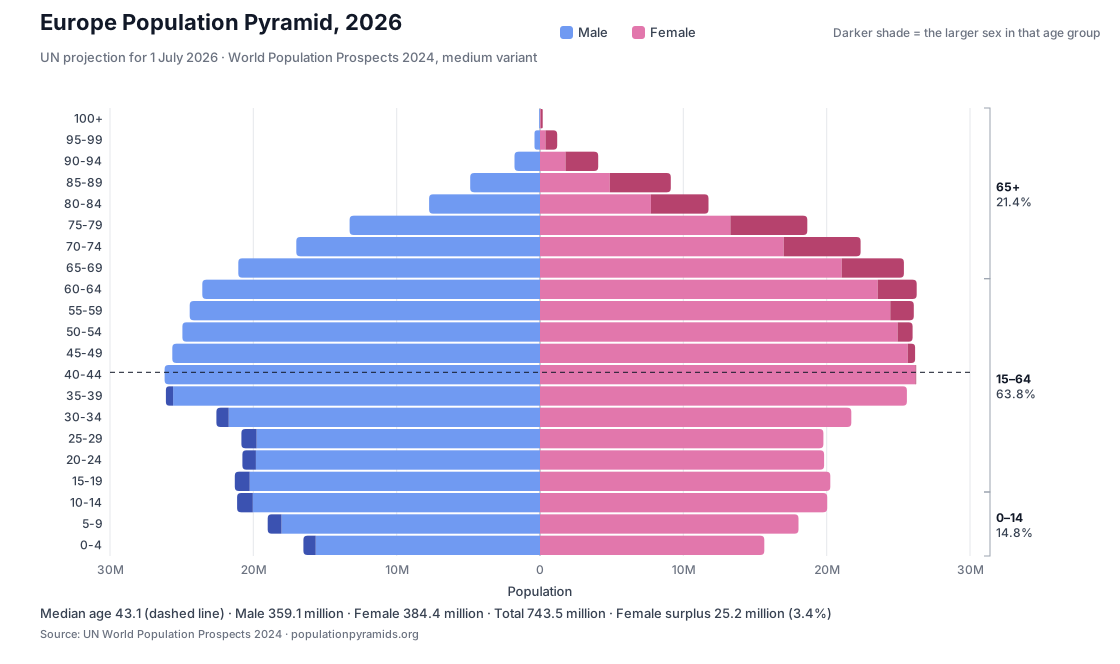
Europe has 743.5 million people in the UN projection for 2026, and its population pyramid is narrow at the base: 14.8% are under 15 and 21.4% are 65 or older. Deaths outnumber births, 8.5 million to 6.1 million, so the population shrinks slowly even with 1.3 million more people moving in than out. Below: the pyramid, the European Union's population, birth rates in every European country, and how fast Europe is aging.
Data: UN World Population Prospects 2024, a projection for 1 July 2026 (medium variant); European Union figures from Eurostat.
Europe's population pyramid

Show the numbers
| Age group | Male | Female | Total | Share |
|---|---|---|---|---|
| 100+ | 34,671 | 169,757 | 204,428 | 0.03% |
| 95-99 | 381,938 | 1,200,031 | 1,581,969 | 0.21% |
| 90-94 | 1,777,207 | 4,062,752 | 5,839,959 | 0.79% |
| 85-89 | 4,870,972 | 9,124,837 | 13,995,809 | 1.88% |
| 80-84 | 7,737,443 | 11,758,635 | 19,496,078 | 2.62% |
| 75-79 | 13,286,722 | 18,648,107 | 31,934,829 | 4.30% |
| 70-74 | 17,003,785 | 22,370,000 | 39,373,785 | 5.30% |
| 65-69 | 21,047,273 | 25,388,146 | 46,435,419 | 6.25% |
| 60-64 | 23,561,689 | 26,279,306 | 49,840,995 | 6.70% |
| 55-59 | 24,438,801 | 26,077,878 | 50,516,679 | 6.79% |
| 50-54 | 24,945,645 | 25,992,502 | 50,938,147 | 6.85% |
| 45-49 | 25,654,137 | 26,166,419 | 51,820,556 | 6.97% |
| 40-44 | 26,192,107 | 26,227,001 | 52,419,108 | 7.05% |
| 35-39 | 26,098,570 | 25,597,056 | 51,695,626 | 6.95% |
| 30-34 | 22,575,076 | 21,720,443 | 44,295,519 | 5.96% |
| 25-29 | 20,835,466 | 19,770,195 | 40,605,661 | 5.46% |
| 20-24 | 20,760,350 | 19,821,309 | 40,581,659 | 5.46% |
| 15-19 | 21,290,056 | 20,256,807 | 41,546,863 | 5.59% |
| 10-14 | 21,131,918 | 20,036,904 | 41,168,822 | 5.54% |
| 5-9 | 18,999,000 | 18,035,901 | 37,034,901 | 4.98% |
| 0-4 | 16,503,716 | 15,651,829 | 32,155,545 | 4.32% |
| Total | 359,126,542 | 384,355,815 | 743,482,357 | 100.00% |
| Female surplus 25,229,273 (3.4% of the population). Source: UN World Population Prospects 2024, five-year age groups, projection for 1 July 2026. | ||||
By the rule this site applies to every country, Europe's pyramid is constrictive: the youngest age groups are smaller than the ones in their 30s and 40s. Women outnumber men by 25.2 million, all of it at older ages: from 65 up there are 140 women for every 100 men.
Source: UN World Population Prospects 2024, the UN region Europe (which includes Russia and Ukraine), five-year age groups, projection for 1 July 2026.
European Union population
On 1 January 2026 the 27 countries of the European Union had 452.0 million people, according to Eurostat, 706,000 more than a year earlier. In 2025 the EU recorded 3.5 million births and 4.8 million deaths; net migration of 2.1 million turned that loss into growth. Deaths have outnumbered births in the EU every year since 2012. The five largest members, Germany, France, Italy, Spain and Poland, hold 66% of the total.
| # | Country | Eurostat, 1 Jan 2026 | Share of EU | UN, 1 Jul 2026 |
|---|---|---|---|---|
| 1 | Germany | 83,467,117 | 18.5% | 83,644,259 |
| 2 | France | 69,112,309 p | 15.3% | 66,746,401 |
| 3 | Italy | 58,942,828 p | 13.0% | 58,926,167 |
| 4 | Spain | 49,590,099 p | 11.0% | 47,850,792 |
| 5 | Poland | 36,332,765 | 8.0% | 37,843,189 |
| 6 | Romania | 19,041,322 e | 4.2% | 18,800,604 |
| 7 | Netherlands | 18,130,208 | 4.0% | 18,448,776 |
| 8 | Belgium | 11,955,308 p | 2.6% | 11,774,643 |
| 9 | Portugal | 11,424,031 | 2.5% | 10,395,363 |
| 10 | Czech Republic | 10,915,839 | 2.4% | 10,527,780 |
| 11 | Sweden | 10,605,529 | 2.3% | 10,701,046 |
| 12 | Greece | 10,366,586 ep | 2.3% | 9,897,115 |
| 13 | Hungary | 9,488,428 | 2.1% | 9,585,818 |
| 14 | Austria | 9,215,956 | 2.0% | 9,107,265 |
| 15 | Bulgaria | 6,423,207 | 1.4% | 6,667,660 |
| 16 | Denmark | 6,025,603 | 1.3% | 6,023,520 |
| 17 | Finland | 5,652,881 | 1.3% | 5,621,738 |
| 18 | Ireland | 5,510,565 | 1.2% | 5,356,950 |
| 19 | Slovakia | 5,409,407 | 1.2% | 5,451,341 |
| 20 | Croatia | 3,876,002 | 0.9% | 3,822,344 |
| 21 | Lithuania | 2,887,592 | 0.6% | 2,797,338 |
| 22 | Slovenia | 2,135,107 | 0.5% | 2,114,574 |
| 23 | Latvia | 1,845,096 | 0.4% | 1,835,934 |
| 24 | Estonia | 1,360,745 | 0.3% | 1,331,062 |
| 25 | Cyprus | 996,571 p | 0.2% | 1,382,334 |
| 26 | Luxembourg | 690,959 | 0.2% | 687,449 |
| 27 | Malta | 588,254 | 0.1% | 549,011 |
| European Union | 451,990,314 ep | 100.0% | 447,890,473 |
 Germany
 France
 Italy
 Spain
 Poland
 Romania
 Netherlands
 Belgium
 Portugal
 Czech Republic
 Sweden
 Greece
 Hungary
 Austria
 Bulgaria
 Denmark
 Finland
 Ireland
 Slovakia
 Croatia
 Lithuania
 Slovenia
 Latvia
 Estonia
 Cyprus
 Luxembourg
 Malta
The UN's projection for the same 27 countries is 447.9 million for 1 July 2026, 4.1 million lower than Eurostat's count. Its figures run forward from estimates that end in 2023, while Eurostat collects each member country's own population statistics, so for official EU figures use Eurostat's. For Cyprus the gap is widest (1,382,334 in the UN figures, 996,571 in Eurostat's): the UN's estimates for Cyprus draw on figures that include Turkish Cypriots (WPP 2024 data sources).
Sources: Eurostat, Population on 1 January (tps00001) and demographic balance (demo_gind), updated 27 October 2026; flags: e = estimated, p = provisional; 2025 births, deaths and migration are provisional. UN column: UN World Population Prospects 2024, projection for 1 July 2026 (medium variant).
Birth rates in European countries
Europe's birth rate is 8.3 per 1,000 people in the UN's 2026 projection, about half the world's 16.0, and its fertility rate is 1.41 children per woman. Across the 43 European countries the birth rate runs from 10.8 in Iceland to 5.8 in San Marino.
- 1.Iceland10.8
- 2.Montenegro10.7
- 3.Moldova10.1
- 4.Luxembourg10.1
- 5.Denmark9.9
- 6.Ireland9.8
- 7.Monaco9.7
- 8.United Kingdom9.7
- 9.Albania9.7
- 10.Netherlands9.5
 Iceland
 Montenegro
 Moldova
 Monaco
 United Kingdom
 Albania
 San Marino
 Ukraine
 Belarus
 Andorra
Deaths first outnumbered births in Europe in 1993. Births drew level again from 2008 to 2014, and deaths have led every year since 2015; the UN projects them to stay ahead through 2100. Every country's birth rate is on the birth rate by country page.
Source: UN World Population Prospects 2024, projection for 2026 (medium variant). Rates for 1950 to 2023 are UN estimates.
European population growth rate
Europe's population changes by −0.12% from 1 July 2025 to 1 July 2026, the only one of the six world regions with a falling population. The UN puts the peak at 749.5 million in 2020 and projects 703.0 million by 2050 and 592.3 million by 2100. 27 of the 43 European countries are shrinking in 2026; growth rates for each of them are on the population growth rate by country page.
| UN subregion | Population 2026 | Growth rate | Fertility rate | Population 2050 |
|---|---|---|---|---|
| Northern Europe | 110.0 million | +0.42% | 1.50 | 115.8 million |
| Western Europe | 199.5 million | −0.09% | 1.51 | 196.3 million |
| Southern Europe | 150.3 million | −0.30% | 1.30 | 135.2 million |
| Eastern Europe | 283.7 million | −0.26% | 1.40 | 255.7 million |
Source: UN World Population Prospects 2024, the UN's own totals for Europe and its subregions: estimates to 2023, medium-variant projections from 2024. Growth rate = the change in population from 1 July 2025 to 1 July 2026. The UN totals include territories that are not among this site's countries.
Aging population in Europe
In 1950, 7.9% of Europeans were 65 or older and 26.6% were under 15. Older people have outnumbered children since 2006, and the UN projects the 65-and-over share to reach 28.6% by 2050 and 31.8% by 2100. The oldest populations, by median age, are Monaco (53.1), San Marino (49.1), Italy (48.6), Portugal (47.2) and Greece (47.1); every country is on the median age by country page, and the cost to working-age people is measured by the old-age dependency ratio.
Source: UN World Population Prospects 2024, five-year age groups for the UN region Europe: estimates to 2023, medium-variant projections from 2024. Median ages: UN projection for 2026.
Frequently asked questions
Figures: UN World Population Prospects 2024 (projections for 2026 on, estimates before 2024) and Eurostat for the European Union.
What is the population of Europe in 2026?
743.5 million in the UN's 2026 projection. Europe's population peaked at 749.5 million in 2020 and the UN projects 703.0 million for 2050 and 592.3 million for 2100.
What is the population of the European Union?
452.0 million on 1 January 2026, Eurostat's first estimate for the 27 member countries. Germany is the largest, with 83.5 million people, and Malta the smallest, with 588,000.
What type of population pyramid does Europe have?
A constrictive one, by the rule this site uses for every country: 14.8% of Europeans are under 15 and the youngest age groups are smaller than those in their 30s and 40s. The median age is 43.1.
Which European country has the highest birth rate?
Iceland, with 10.8 births per 1,000 people in the UN's 2026 projection, followed by Montenegro, Moldova and Luxembourg. The lowest is San Marino, at 5.8.
Is Europe's population shrinking?
Yes, slowly. In the UN figures it peaked in 2020 and falls 0.12% from 1 July 2025 to 1 July 2026: deaths outnumber births by 2.4 million, and immigration makes up 1.3 million of that. 27 of the 43 European countries are shrinking.
Why is Europe's population getting older?
Fewer births and longer lives. Europe's fertility rate has been below 2.1 children per woman since 1975, and life expectancy rose from 62.0 years in 1950 to 79.6 in 2026. Since 2006 Europe has had more people aged 65 and over than children under 15.
Population pyramids of other regions: Africa and Middle East. Every country has its own page, listed on countries by population.
Related demographic tools & calculators
- Population Projection 2050 & 2100UN-projected population for any country, any year through 2100, plus peak-year info
- Life Expectancy by CountryLife expectancy at birth for 194 countries, 1950–2100
- Infant Mortality Rate by CountryDeaths before age 1 per 1,000 live births, 194 countries
- Death Rate by CountryDeaths per 1,000 people, 194 countries, and why older countries rank higher
- US Birth RateUS births and birth rates by year, state and race (CDC)
- World Birth RateWorld births per day, birth and death rates, 1950–2100
- Replacement-Level FertilityWhy 2.1, and each country's own replacement level
- Fertility Rate by CountryFertility and birth rates per country, below-replacement tracker
- Population Density by CountryMost & least crowded countries + "what if" comparisons
- Population When You Were BornWorld population in your birth year vs 2026
- Population Pyramid MakerGenerate custom pyramids from country or your data · PNG/SVG
- What Generation Am I?Gen Z, Millennial, Boomer ranges + 194 country breakdowns
- Median Age by CountryWorld's oldest & youngest populations
- Dependency Ratio CalculatorYouth + elderly per 100 working-age adults
- Male to Female RatioGender ratio per country, age band, and globally
Sources
UN World Population Prospects 2024: population by five-year age group and sex, births, deaths, fertility, median age and net migration for Europe, its subregions and its countries, with estimates for 1950–2023 and medium-variant projections from 2024. Eurostat: population of the European Union and its members on 1 January 2026, and the EU's births, deaths and net migration. The pyramid image and charts are drawn from these figures.